No Lab, No Problem: Record CML2 Devices into pyATS Mocks for CI
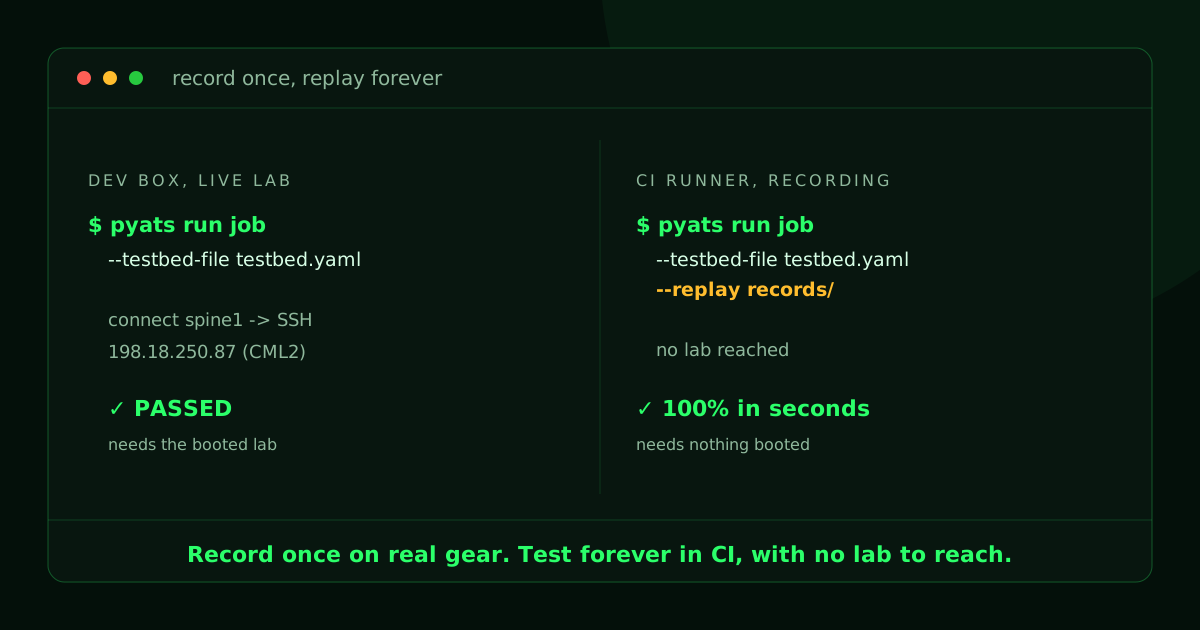
Part 4 of a series pairing Cisco Modeling Labs 2 with Cisco pyATS for network programmability.
We have a lab and a routine. Back in first part of this build we setup a four-node spine-leaf in CML2 and generated the pyATS testbed straight from the CML API. Next, we drove tests from NetBox, and last time we snapshotted the fabric with genie diff. Every one of those posts assumed the lab was up and you could reach it.
Now I want to put those tests in a pipeline, and the assumption falls apart. A GitHub Actions runner cannot see my CML2 server. Even if it could, I do not want every push to wait on a lab booting, or to burn a CML license seat on a job that runs for fifteen seconds. The lab is the right place to develop. It is the wrong place to anchor CI.
So here is the move: connect to the real devices once, record what they say, and commit. Then in CI, point the exact same pyATS suite at the recording with one extra flag. The tests do not know the difference, and they run in seconds with nothing booted.
Takeaway up front: record once on real gear, test forever in CI for free. The lab stays where it belongs, on the developer's desk, and the pipeline carries a recording instead of a dependency.
What a mock device actually is
pyATS ships with the idea of a mock device: a simulated box that answers a fixed set of commands with pre-recorded output. It is a deliberately dumbed-down stand-in. It knows the prompt, it knows the modes (exec, config, config-line), and it knows the handful of show commands you fed it.
That sounds limiting, and it is, but for testing it is exactly enough. The point of a pyATS test is rarely "can I reach the device." It is "given this output, do my assumptions hold." This mock device gives you the output, deterministically, offline, with the same testbed file and the same Genie parsers you already use. Nothing in your test code changes.
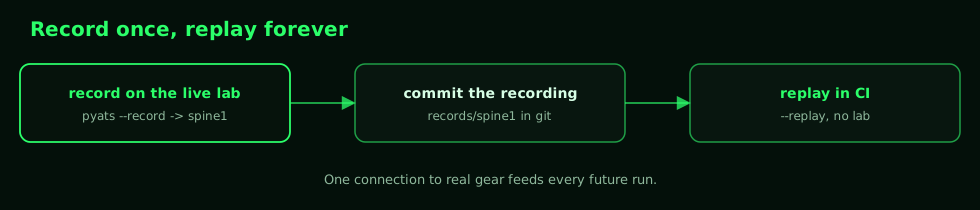
Three steps: record, commit, replay. Let me walk each one against the spine-leaf fabric from part one, and I will flag the few places where the commands have drifted from what the docs show.
Record the real device
Recording is a side effect of running a normal pyATS script with a flag. You write a tiny script that connects and runs the commands you want captured, and unicon writes the whole session to disk when you add --record.
The script is almost nothing. Load the testbed, connect to spine1, run the commands. The list matters: replay can only answer what you recorded, so every command your tests will later issue has to appear here.
# data_collect.py
from genie.testbed import load

# Every command the suite will ask for later must be recorded here.
LIST_OF_CMDS = [
    "show ip route",
    "show ip interface brief",
    "show ip ospf neighbor",
]

testbed = load("testbeds/testbed.yaml")
device = testbed.devices["spine1"]

device.connect(log_stdout=False)
for command in LIST_OF_CMDS:
    device.execute(command)
device.disconnect()
Run it against the live lab with the record flag pointed at a directory:
export PYATS_UNAME=cisco PYATS_PWORD=cisco
python data_collect.py --record ./records
unicon drops one file per device into ./records, named for the device. Here it is records/spine1, and if you cat it you get nothing readable. It is a serialized snapshot of the connection, a pickle, not a transcript. That is fine. It is not meant for human eyes; it is meant for replay. This is the one artifact CI actually needs, so it goes in git.
Turn the recording into a mock you can read
The pickle drives replay, but it is opaque. If you want to see what you captured, or hand a teammate a device they can poke at, unicon will render the recording into a readable YAML mock:
python -m unicon.playback.mock \
  --recorded-data ./records/spine1 \
  --output ./mock_output/spine1_ios.yaml
The YAML is a little state machine. Each device mode is a block, each block lists the commands it knows and the output to return. Here is the shape, trimmed:
execute:
  prompt: switch#
  commands:
    show ip route: |
      Codes: L - local, C - connected, S - static ...
      O        2.2.2.2       [110/21] via 10.0.2.1, Ethernet0/2
      O        11.11.11.11   [110/11] via 10.0.1.1, Ethernet0/1
      O        22.22.22.22   [110/11] via 10.0.2.1, Ethernet0/2
    show ip interface brief: |
      Interface              IP-Address      OK? Method Status   Protocol
      Ethernet0/0            198.18.250.87   YES manual up       up
      ...
That output is the real spine1 talking, captured a moment ago. One cosmetic thing: the renderer labels the prompt switch# instead of the real hostname. If you want the mock to feel like the device, a find-and-replace fixes it:
sed -i '' 's/switch#/spine1#/g' mock_output/spine1_ios.yamlProve the mock answers
Before trusting it in a test, kick the tires. pyATS gives you mock_device_cli, which boots the YAML as a fake device and drops you into a shell:
echo 'show ip route' | mock_device_cli --os ios --hostname spine1 \
  --mock_data_dir mock_output --state execute
And the recorded routing table comes back, with no lab anywhere in sight:
O        2.2.2.2       [110/21] via 10.0.2.1, Ethernet0/2
O        11.11.11.11   [110/11] via 10.0.1.1, Ethernet0/1
O        22.22.22.22   [110/11] via 10.0.2.1, Ethernet0/2
Drifted from the docs: the course material starts the shell with--state connect, which is right when you want to sit in an interactive session and type. If you are piping a command in non-interactively, the way a quick check or a script does, start in--state executeinstead. Withconnectthe device is waiting at the login banner and your piped command lands in the void.
Point the real test at the recording
This is the whole payoff. The test I want is the underlay reachability check this series keeps coming back to: spine1 should have an OSPF route to every other loopback in the fabric. Same testbed, same Genie parser, same assertion as if the lab were live.
# test_underlay.py
from pyats import aetest

# spine1's three fabric peers, learned over OSPF.
REMOTE_LOOPBACKS = ["2.2.2.2/32", "11.11.11.11/32", "22.22.22.22/32"]

class CommonSetup(aetest.CommonSetup):
    @aetest.subsection
    def connect(self, testbed):
        testbed.devices["spine1"].connect(log_stdout=False)

class UnderlayReachability(aetest.Testcase):
    @aetest.test
    def remote_loopbacks_present(self, testbed):
        spine1 = testbed.devices["spine1"]

        # Run the command, then parse the captured text.
        output = spine1.execute("show ip route")
        routes = spine1.parse("show ip route", output=output)

        seen = routes["vrf"]["default"]["address_family"]["ipv4"]["routes"].keys()
        for loopback in REMOTE_LOOPBACKS:
            assert loopback in seen, f"spine1 has no route to {loopback}"

class CommonCleanup(aetest.CommonCleanup):
    @aetest.subsection
    def disconnect(self, testbed):
        testbed.devices["spine1"].disconnect()
Drifted from the docs: thatparse(output=...)pattern is doing real work. The obvious one-liner,spine1.parse("show ip route"), asks Genie to run the command itself, and in replay Genie decides the connection is not a live device and throws "device is not connected, output must be provided." So you do it in two beats:execute()pulls the text (from the lab live, or from the recording in replay), thenparse(output=...)runs the parser on that text. The same code works in both modes, which is the entire goal. The course sidesteps this by asserting on raw strings; I would rather keep part one's promise that an assertion is a dictionary lookup, not a regex.
Now run it. With pyATS, replay is wired in through easypy, so you use a small job file and add the --replay flag pointed at the recordings directory:
pyats run job job.py \
  --testbed-file testbeds/testbed.yaml \
  --replay records/
The flag tells unicon: do not open a connection, replay records/spine1 instead. The testbed is still loaded (replay wants the device defined), but its IP and credentials are never used. The result:
+++ spine1: connecting from the recording +++
Starting testcase UnderlayReachability
The result of remote_loopbacks_present is => PASSED

Overall Stats
    Passed     : 3
    Failed     : 0
    Errored    : 0
Success Rate   : 100.00 %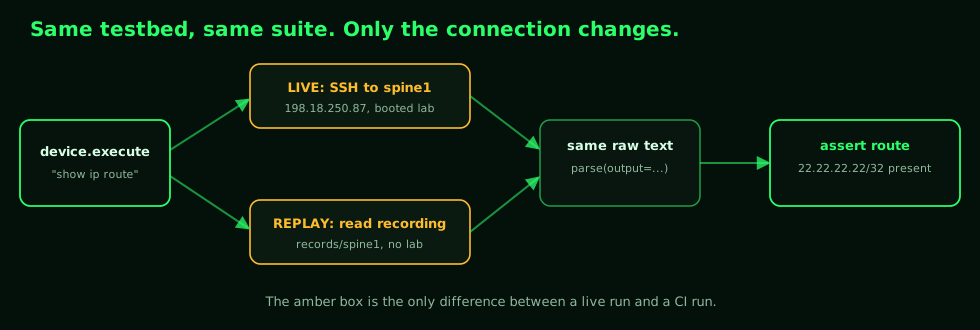
Proving the lab really is out of the loop
It is fair to be suspicious here. The lab was up when I ran that. How do I know replay is not quietly reaching it? So I broke reachability on purpose: I edited the testbed to point spine1 at 203.0.113.99, an address from the documentation range that goes nowhere, and confirmed nothing answers on port 22. Then I ran the same replay.
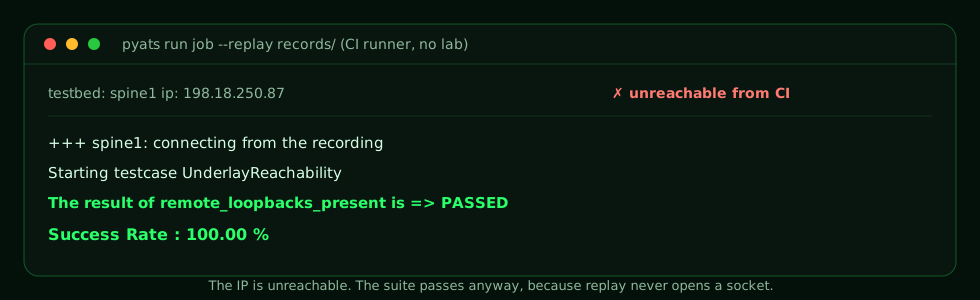
Still 100 percent. The suite passed against an address that cannot be reached, because replay never opened a socket. That unreachable testbed is not a contrived edge case. It is precisely what a CI runner sees: a testbed that names devices it has no path to, and a recording that makes the path unnecessary.
The pipeline
Everything above is local. The reason it matters is that it drops straight into CI with nothing new to learn. The recording is committed, the runner installs pyATS, and the same command runs. Here is the entire GitHub Actions workflow:
name: replay

on:
  push:
  pull_request:
  workflow_dispatch:

jobs:
  replay:
    runs-on: ubuntu-latest
    steps:
      - uses: actions/checkout@v4

      - uses: actions/setup-python@v5
        with:
          python-version: "3.12"
          cache: pip

      - name: Install pyATS
        run: pip install -r requirements.txt

      - name: Run the suite against the recordings (no lab)
        env:
          PYATS_UNAME: cisco
          PYATS_PWORD: cisco
        run: |
          pyats run job job.py \
            --testbed-file testbeds/testbed.yaml \
            --replay records/
That is the whole thing. Check out the repo, install pyATS, replay the suite. No secrets, no VPN to the lab, no service containers, no waiting on a boot. The job finishes in well under a minute, and most of that is pip.
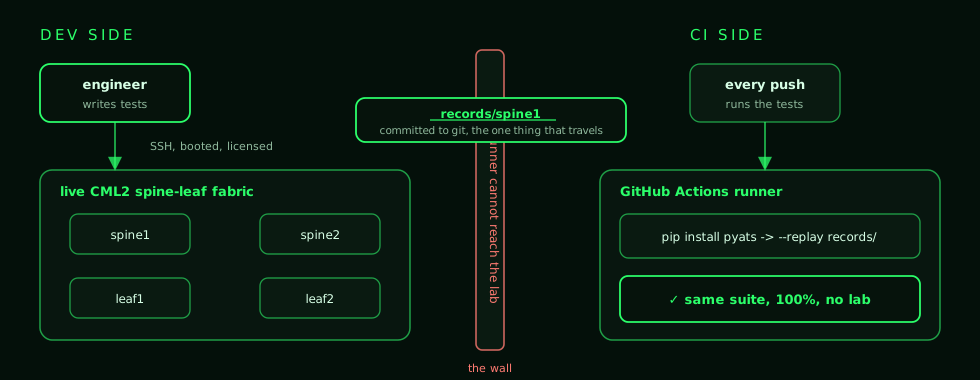
This runs for real. The whole thing lives in github.com/bleekley/pyats-mock-ci: the testbed, the test, the committed records/spine1, and the workflow. Every push runs green in Actions against the recording, no lab attached. Clone it and the replay works on your machine too.
One gotcha that only bites in the wrong order: easypy refuses to run a job if your installed pyATS and Genie minor versions disagree. It treats the mismatch as a hard error and quits before a single test runs. On a workstation that has collected updates over months, this is easy to trip. The fix is the thing CI does for free: a clean install of a pinned pyats[full], so the whole stack matches. It is one more reason the pipeline turns out to be the easy place to run this, not the hard one.
What this is good for, and what it is not
A recording is a photograph. It proves your test logic is correct against a known state, every time, for free. That is the right tool for a lot of CI: catch a broken parser, a typo in an assertion, a refactor that quietly changes what a test checks. It is fast feedback on the test code itself.
What it does not do is notice that the live network changed. If spine1 loses a route tomorrow, the recording still shows it healthy, and the replayed test still passes. That is a feature, not a bug, as long as you remember which question you are asking. Replay tests the test. The live lab, and eventually the production network, tests reality. You want both: replay on every push for speed, and a scheduled run against the real fabric for truth. They are not competitors, they are different rungs on the same ladder.
Where this goes next
We have now tested this fabric four ways: generated the testbed from the lab, driven it from NetBox intent, diffed its state across a change, and recorded it into CI. All of it screen-scrapes show commands, which is where network testing has lived for years. The last post in the series leaves the CLI behind: enable NETCONF, RESTCONF, and gNMI on a node and test model-driven state directly, no parsing required.
Record once on real gear. Test forever in CI.
Appendix: the files in full
Everything below is in the companion repo. The recordings are sanitized lab output: documentation-range addresses and throwaway cisco / cisco credentials, safe to publish.
job.py
import os

from pyats.easypy import run


def main(runtime):
    here = os.path.dirname(__file__)
    run(testscript=os.path.join(here, "test_underlay.py"))
testbeds/testbed.yaml
testbed:
  name: pyATS-SpineLeaf-Fabric
devices:
  spine1:
    os: ios
    credentials:
      default: {username: '%ENV{PYATS_UNAME}', password: '%ENV{PYATS_PWORD}'}
      enable:  {password: '%ENV{PYATS_PWORD}'}
    connections:
      cli: {protocol: ssh, ip: 198.18.250.87, port: 22}
  # ...spine2, leaf1, leaf2...
requirements.txt
# Pinned so the recording and the replay use the same unicon that wrote it.
# A matched set also avoids the easypy version-skew check that aborts mixed installs.
pyats[full]==26.6